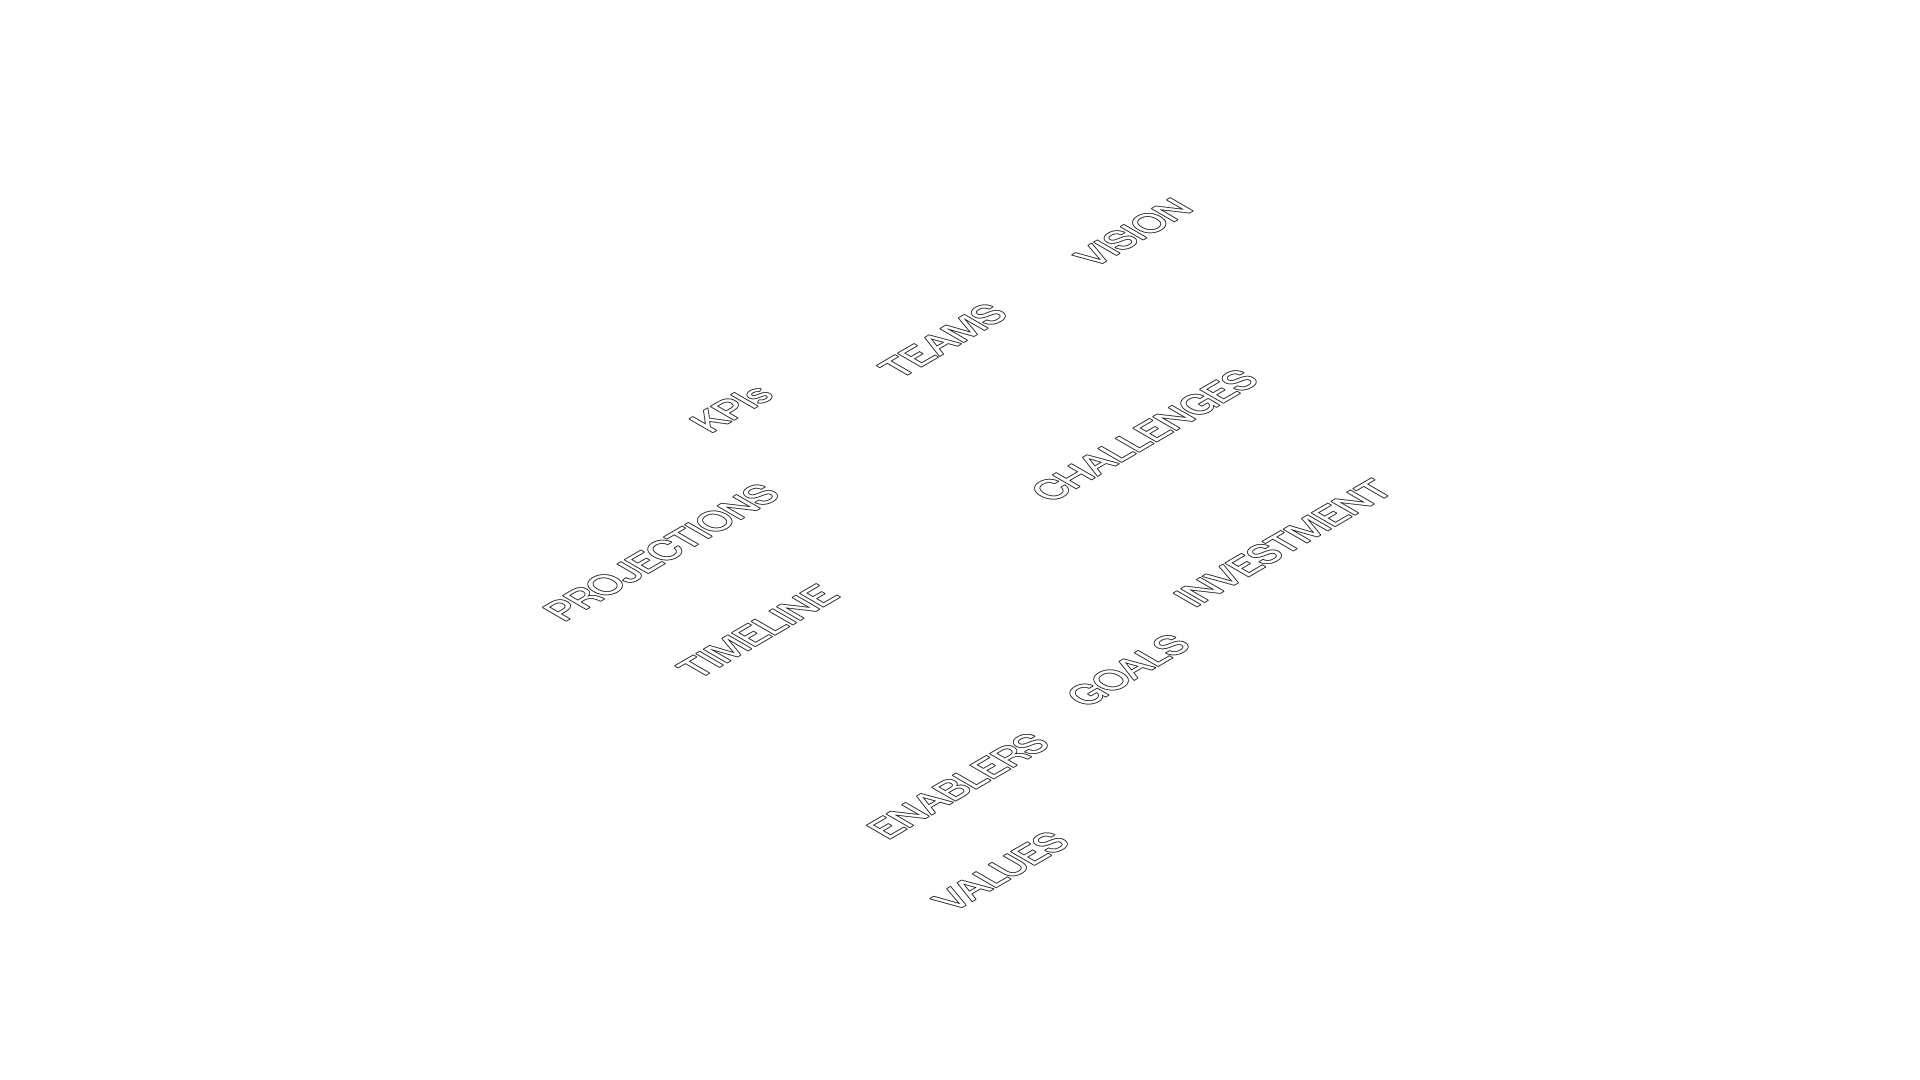
Did you know that all these elements…
Did you know that all
these elements…
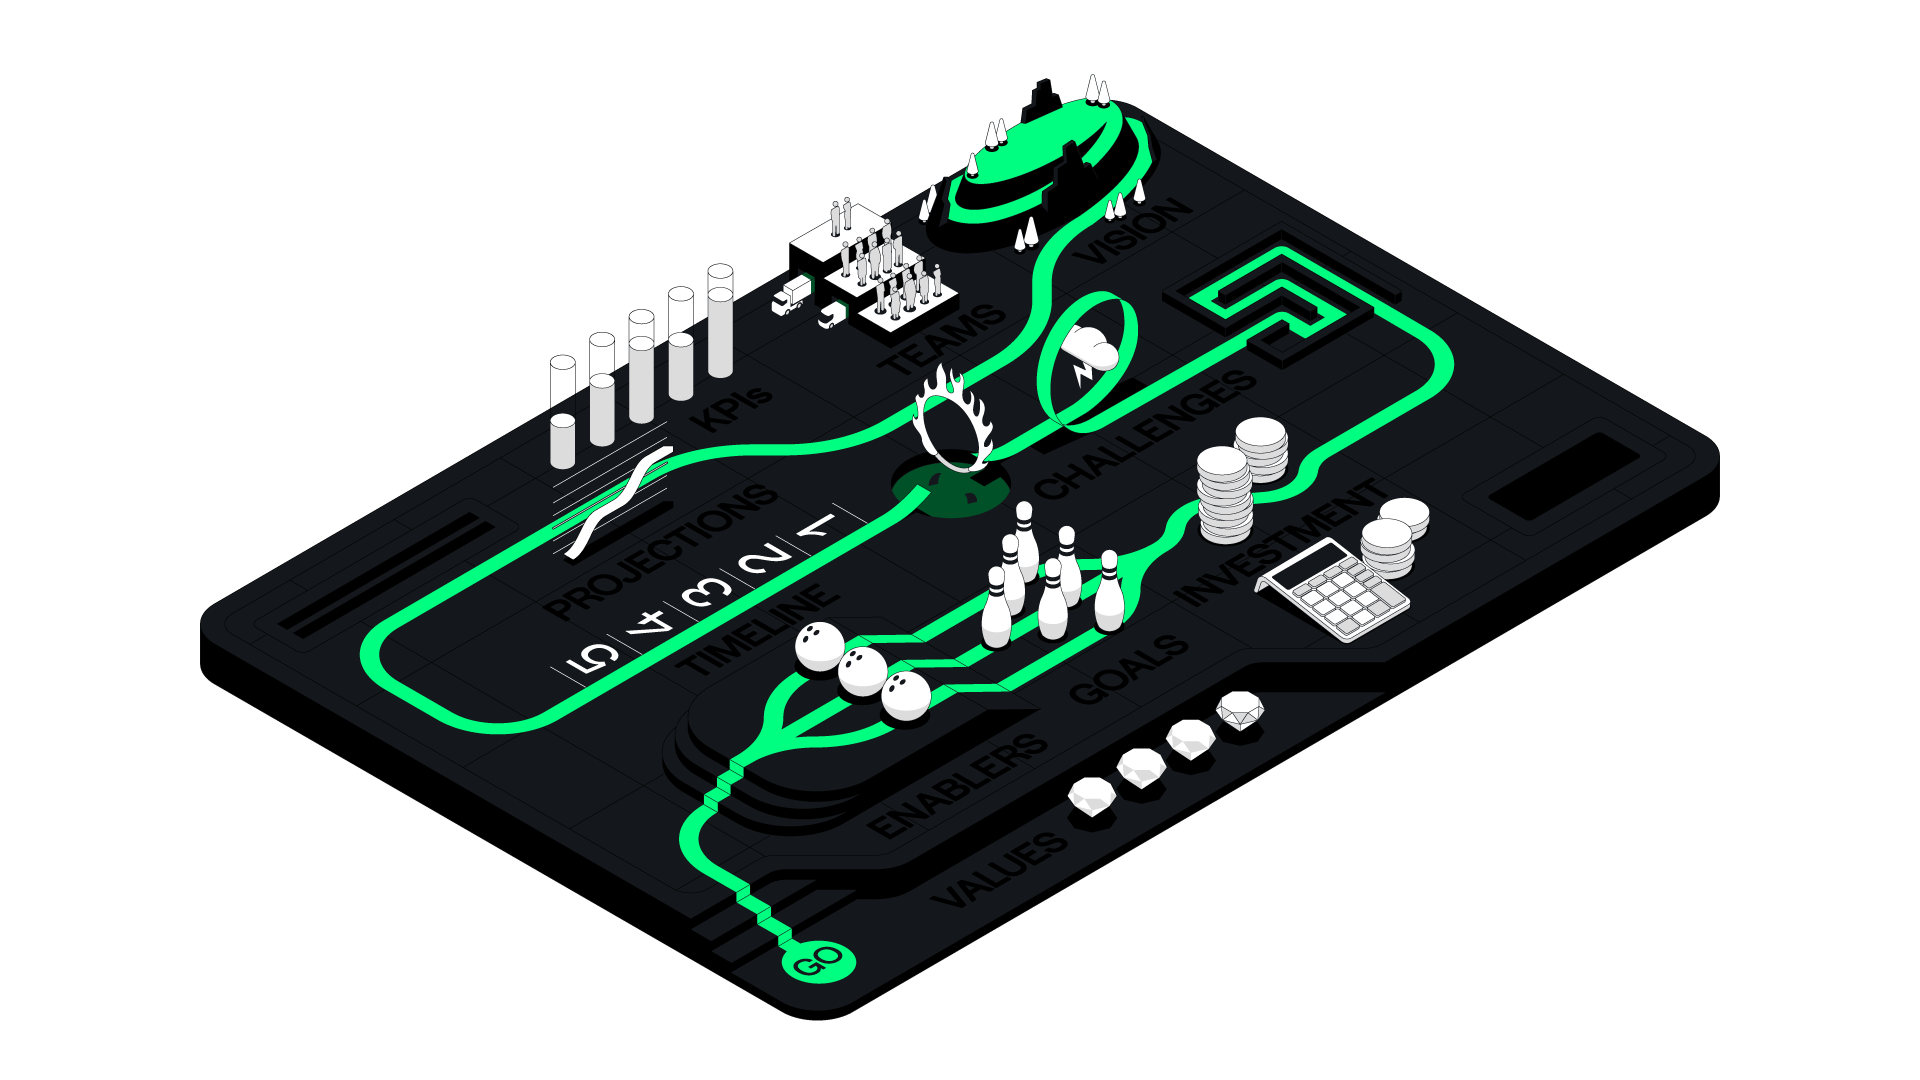
…can be incorporated into a strategy map?
…can be
incorporated
into a strategy map?
The dictionary definition makes the basic case for using Visualisation:
Visualisation
verb, noun
The act of creating an image to represent information in a way that makes it easier to understand, or an example of such an image.
Learn more about Visualisation here:
VISUALISATION
The business case
By visually mapping a strategy onto a single page, all its key features appear in our field of vision simultaneously. This does a lot of the brain’s heavy lifting when it comes to understanding any complex scenario, giving us an overview of the entire strategy and allowing us to start joining the dots without having to rely on recall — something our brains struggle with even after very little complexity has arisen.
This freed-up cognitive capacity inspires more innovative, systemic thinking which, in turn, gives rise to real progress and change. And therein lies the power of visualisation for business.
[ GET IN TOUCH ]
process
How are strategy maps created?
It’s all about the process. In a nutshell, this is what it looks like:

1. Contact
The first call or meeting to discuss viability based on the broad parameters of the job, including scope, timeline, budget etc.
30–60 MINS

2. Immersion
A deep-dive session to analyse the brief in detail to gain a full understanding of the scope, goals and desired results, plus agree workflow, deliverables and timeline.
2–4 HOURS

3. Create
From initial creative concepts through to finished visual, this iterative process consists of design and review cycles until the work is finished. Timings differ significantly depending on complexity, illustration style, speed of feedback etc.
2–6 WEEKS

4. Launch
The timing of the launch is key to maximising the visual’s impact. If part of a wider campaign, consider how other events could distract from the visual’s rollout, and which could complement it.

HOME
WORK
PLAY
SERVICES
VISUALISATION
© NVISION DESIGN LTD 2026
ALL RIGHTS RESERVED